


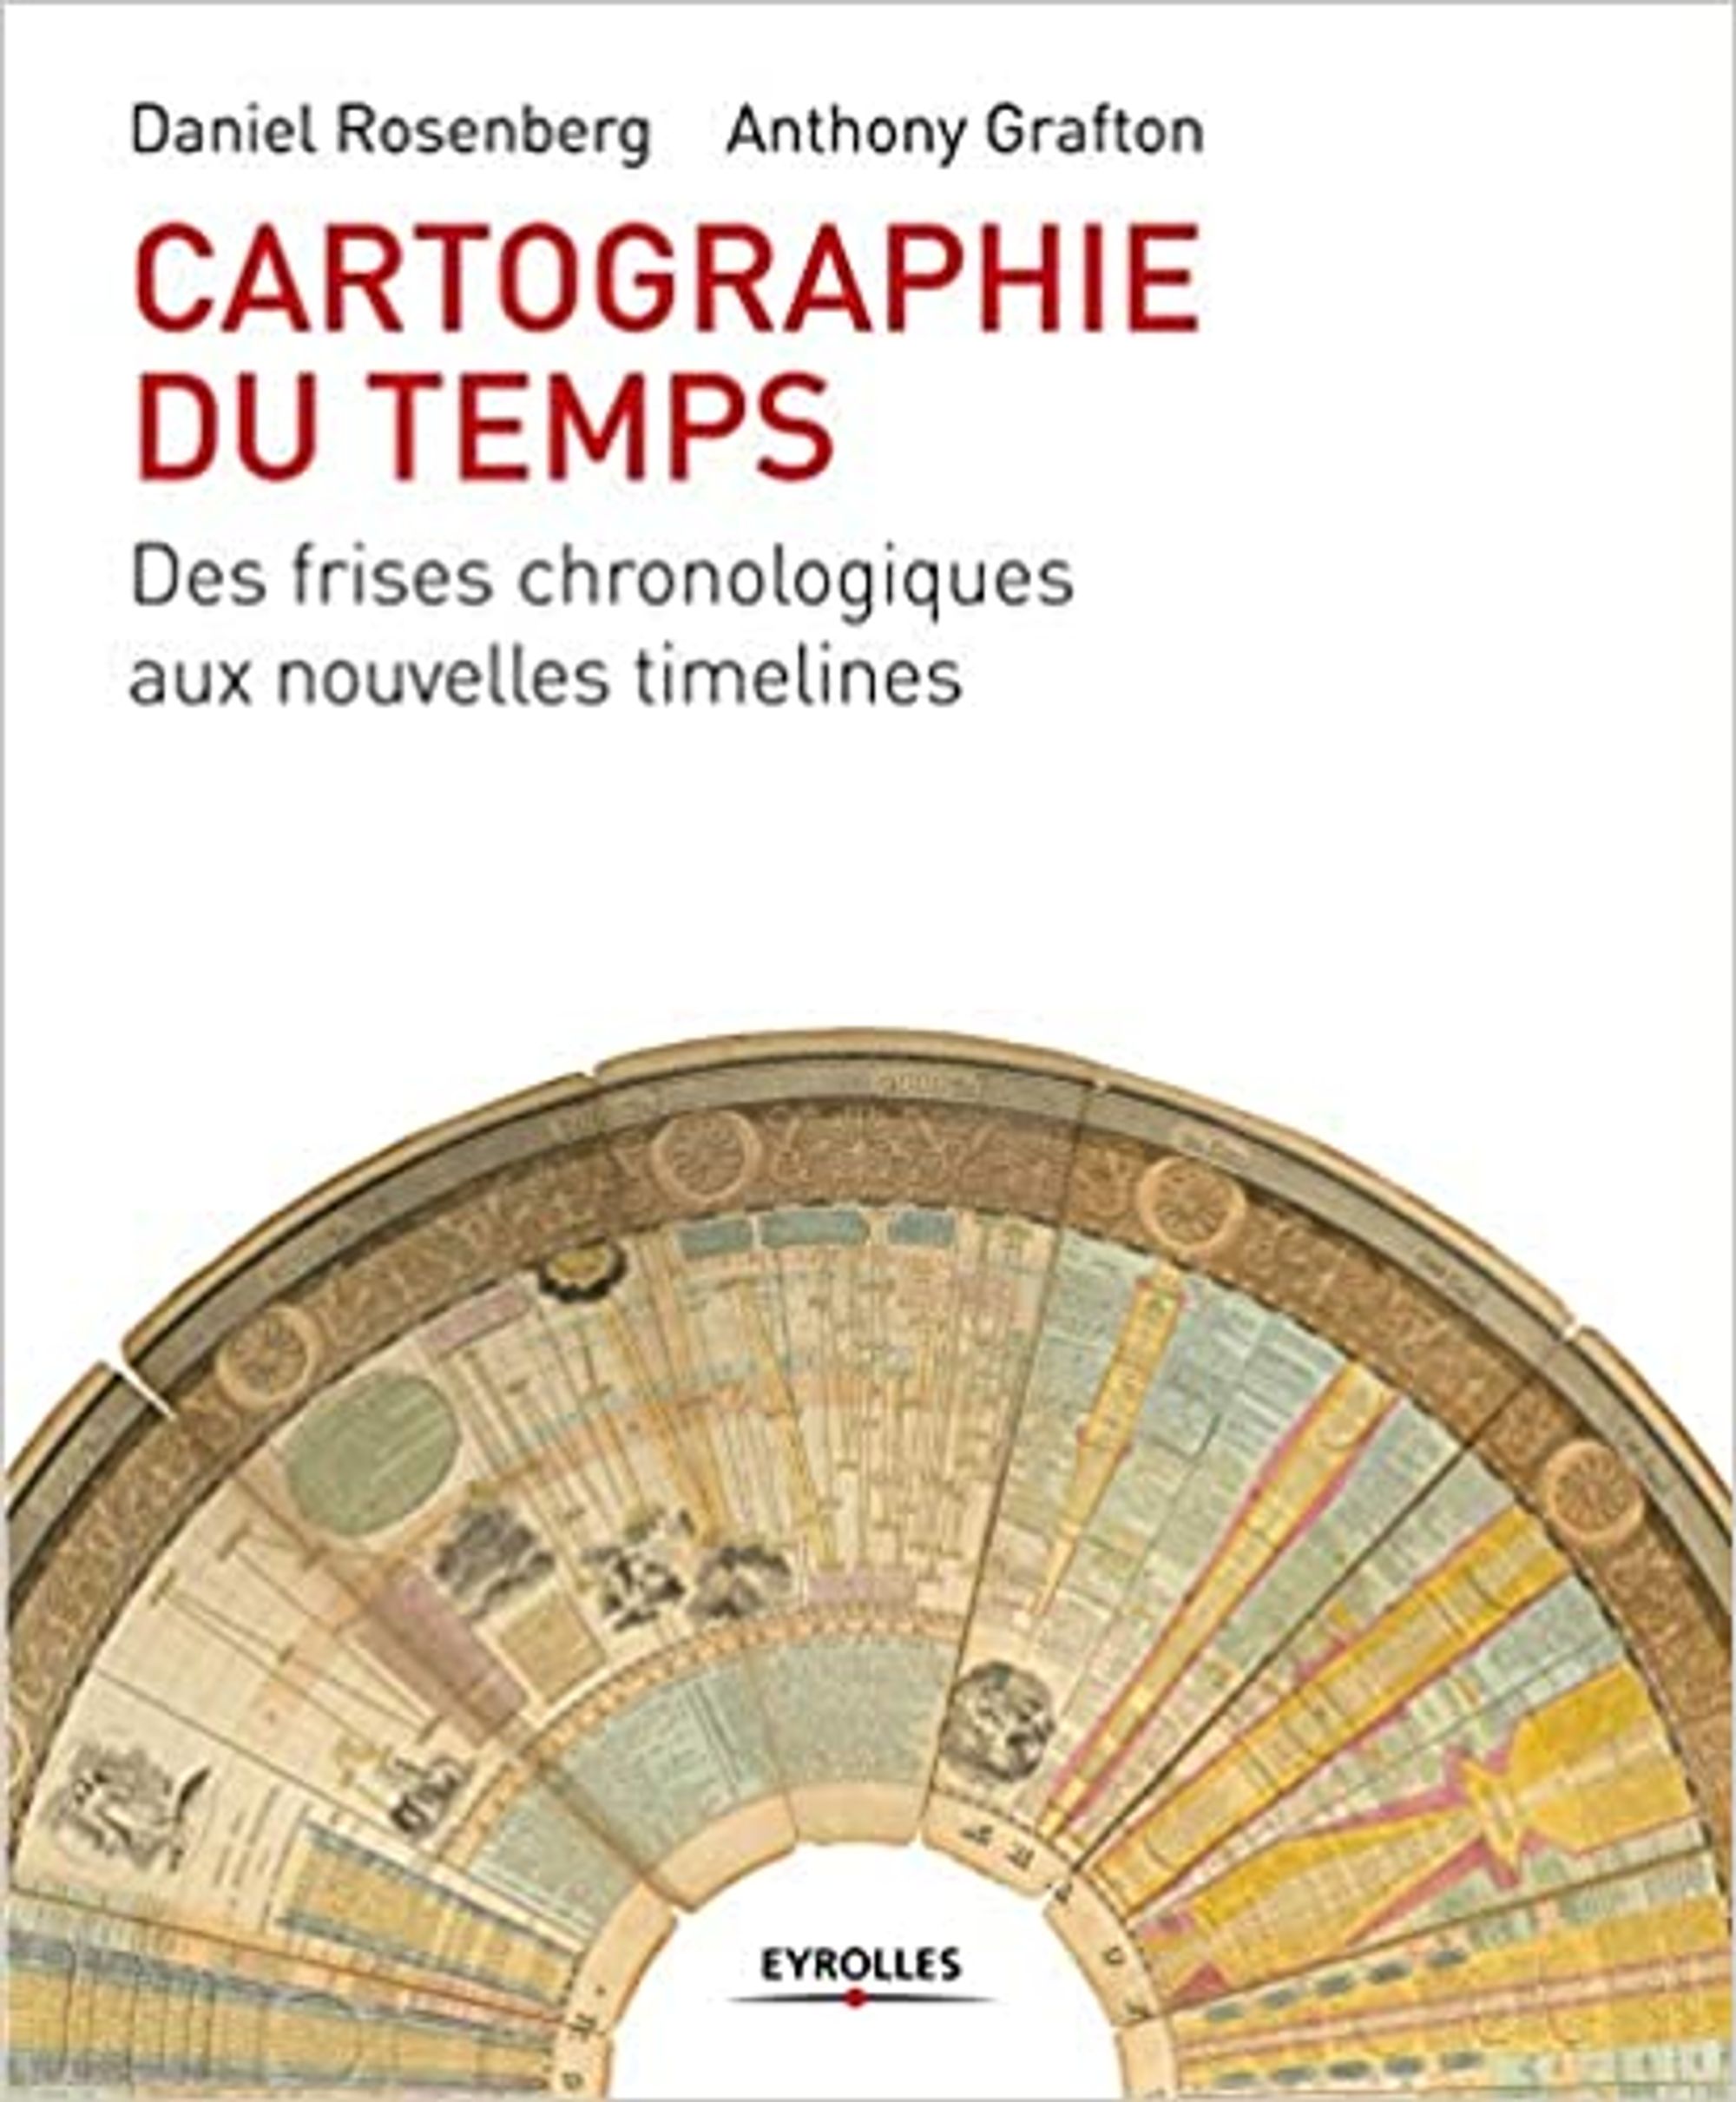
Cartographie du temps
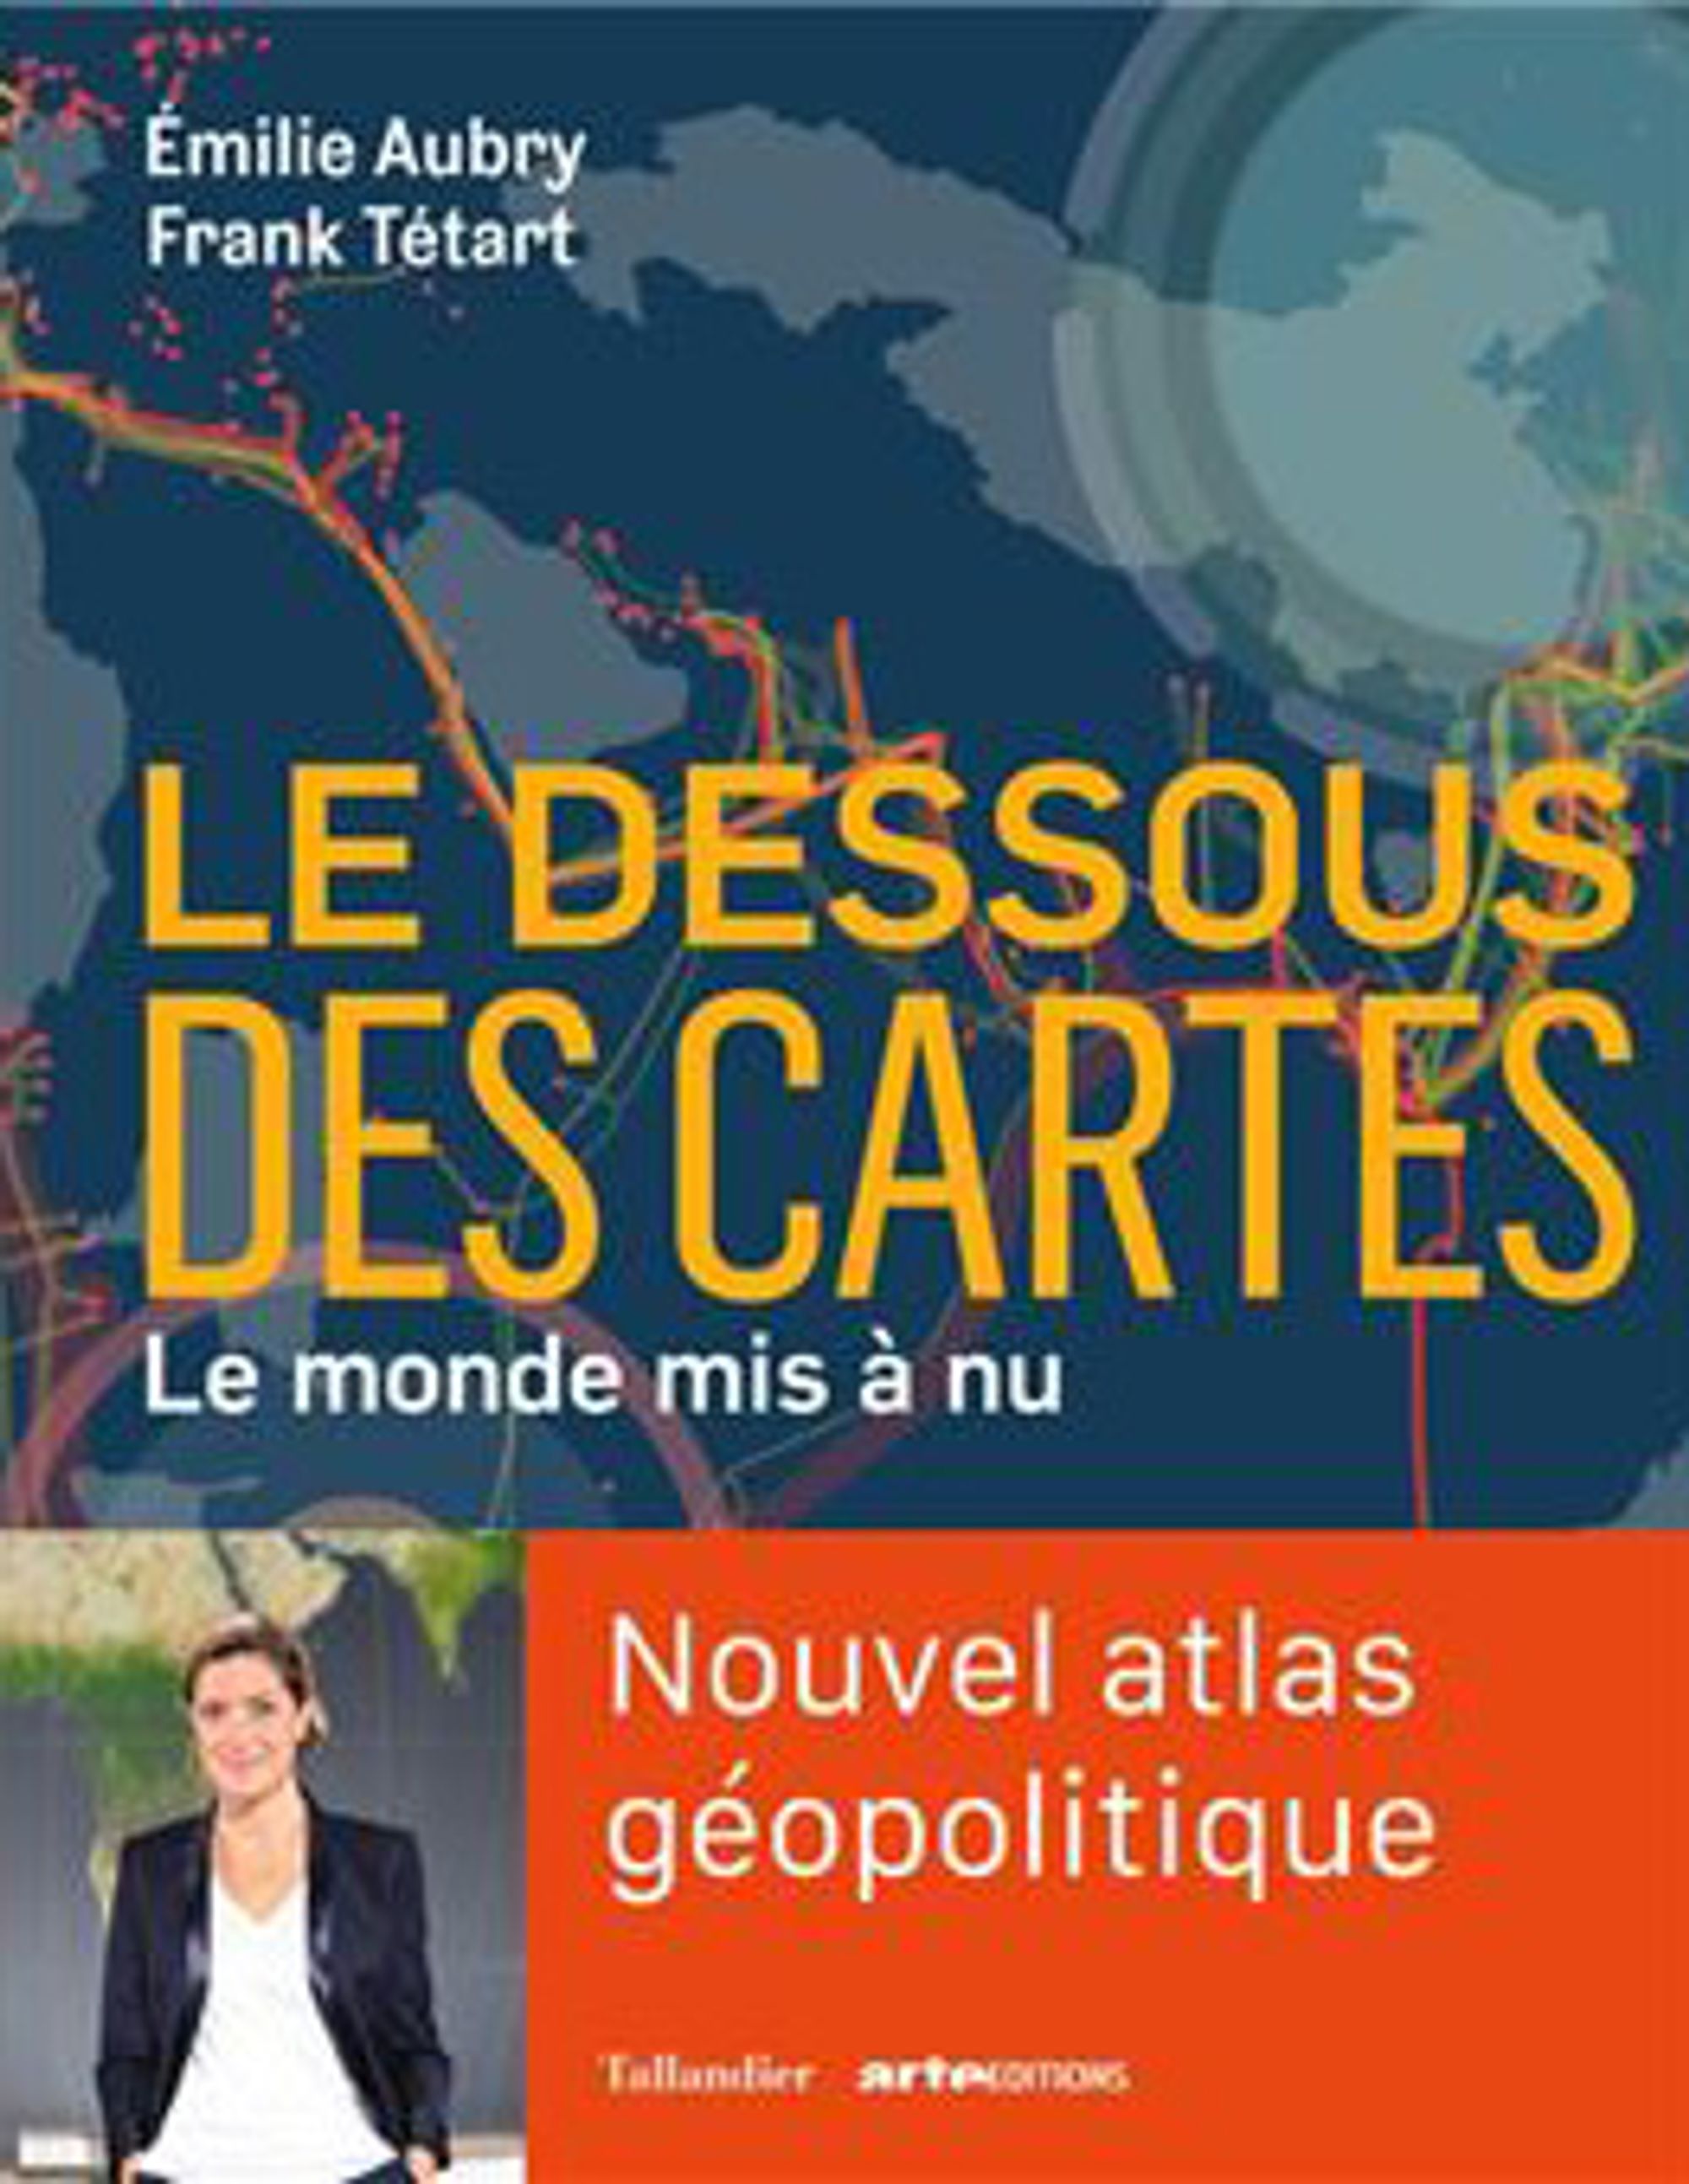
Le dessous des cartes
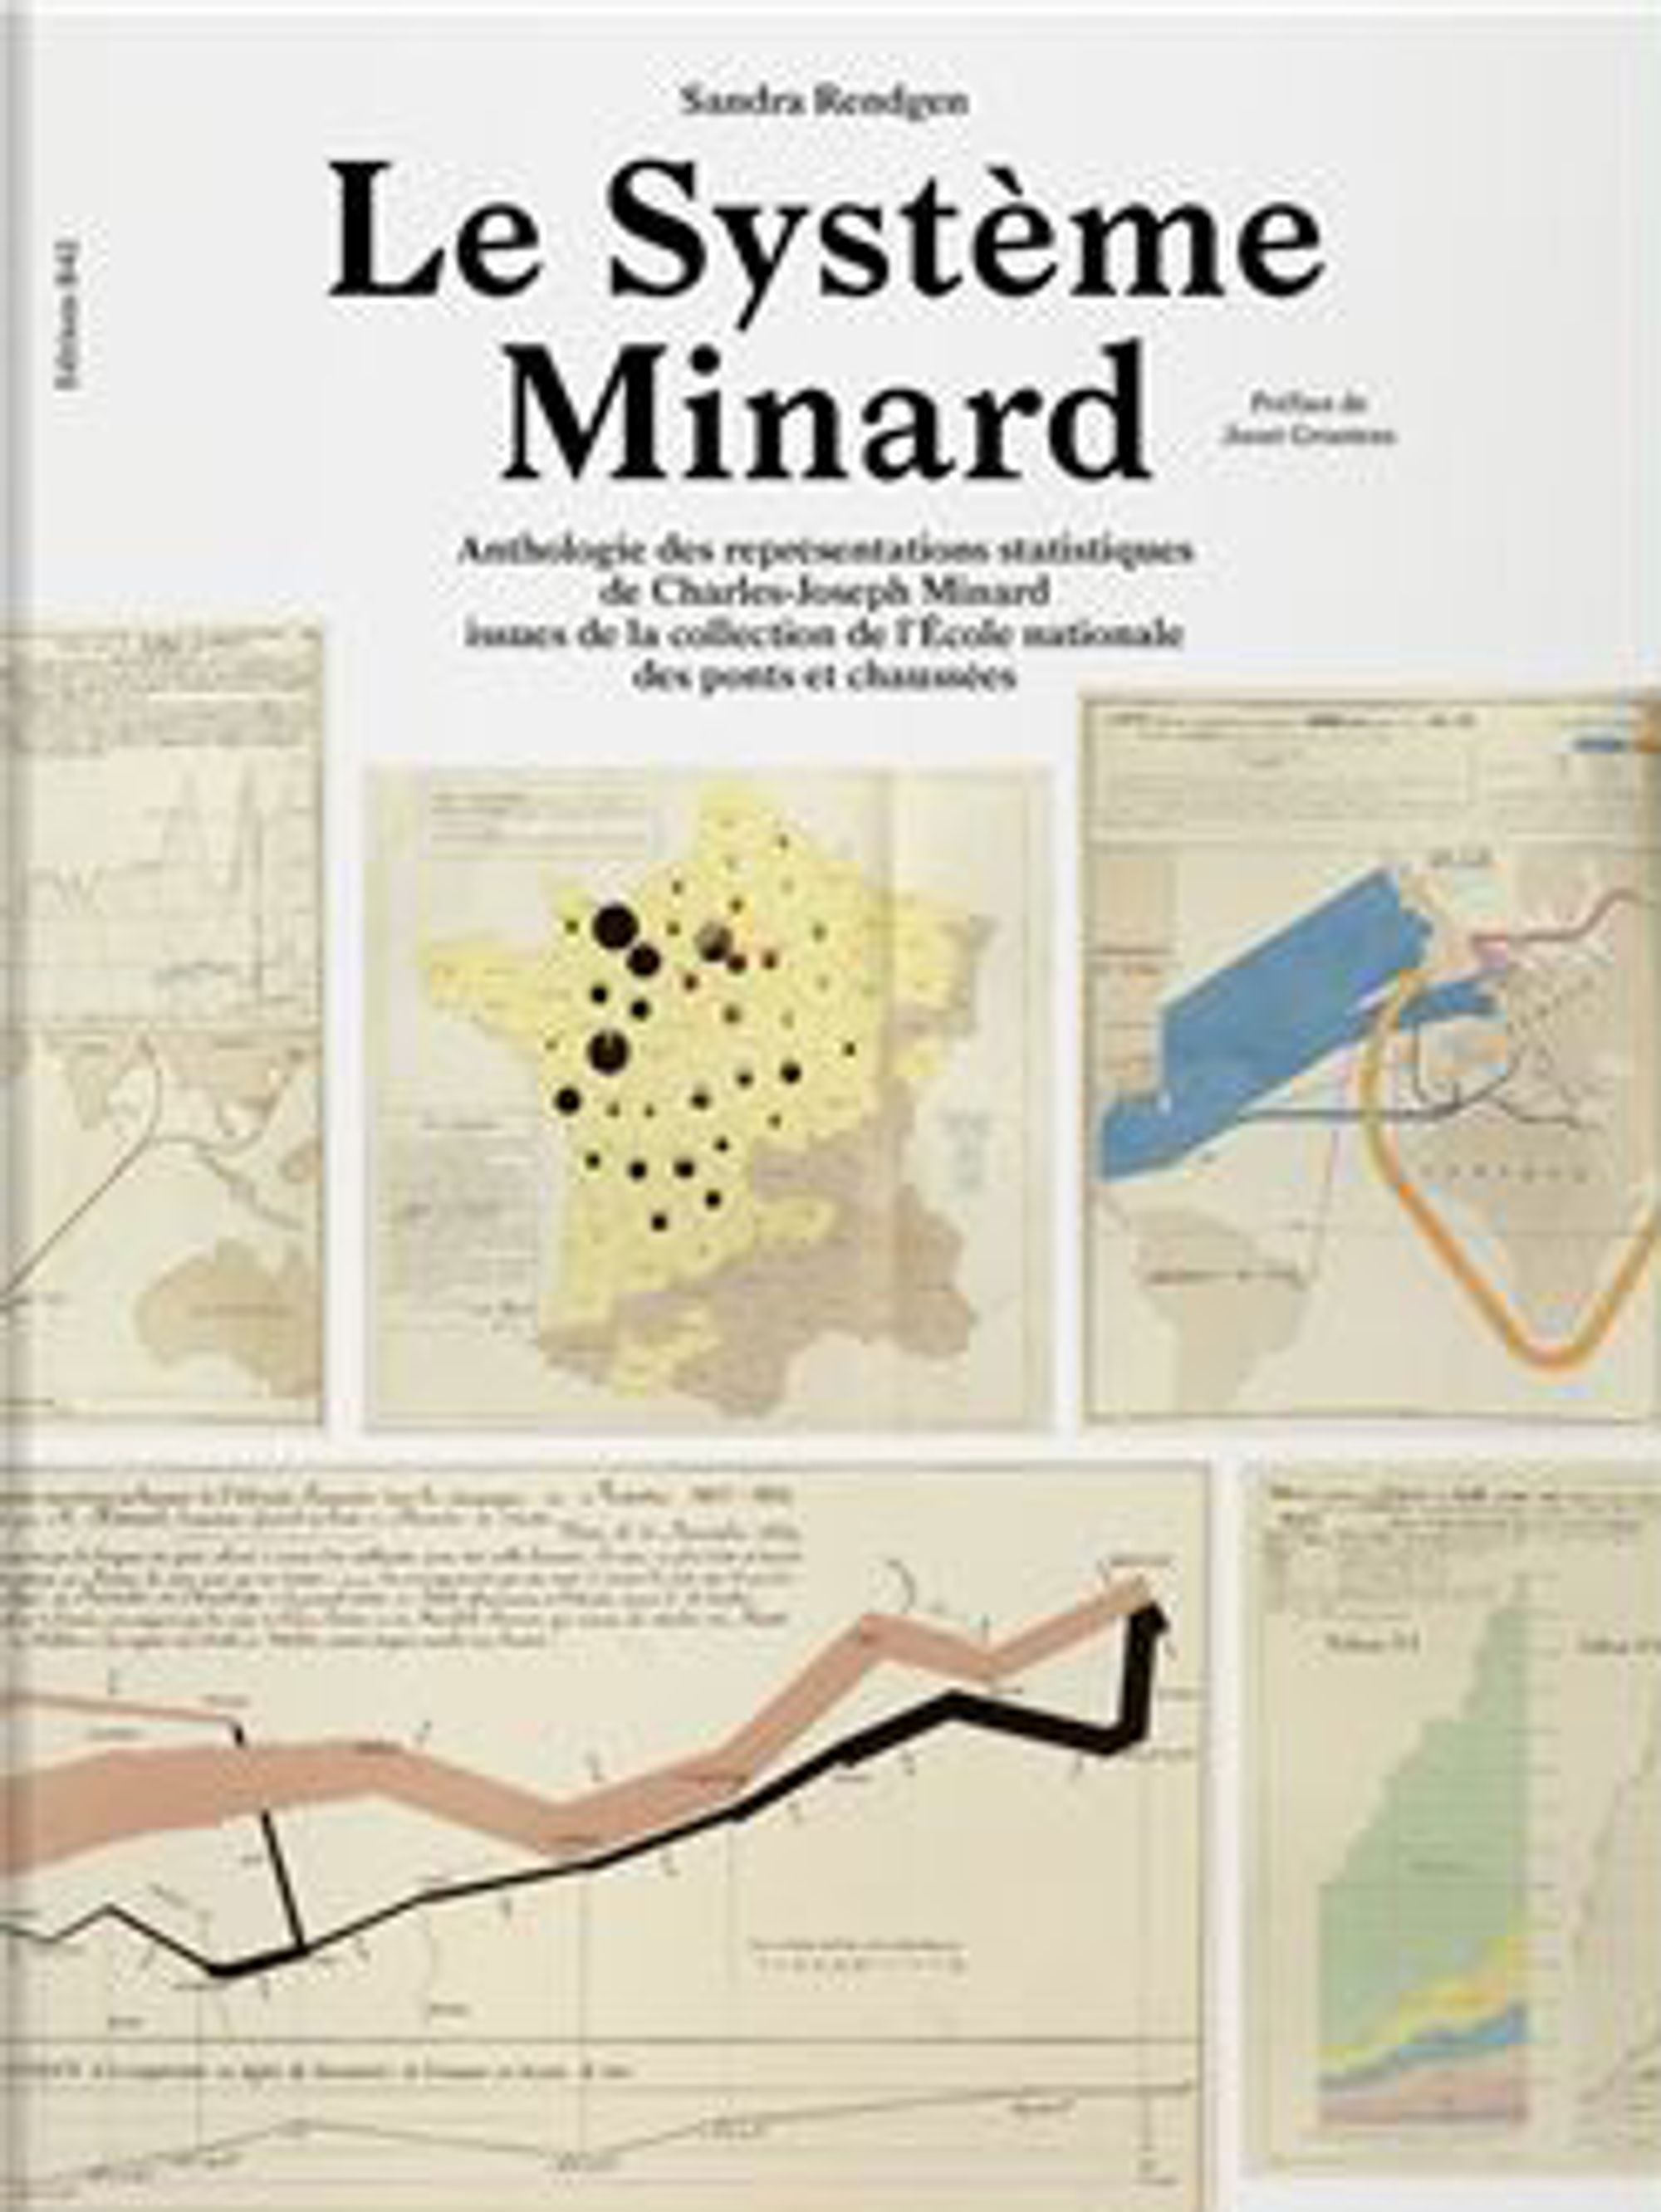
Le Système Minard
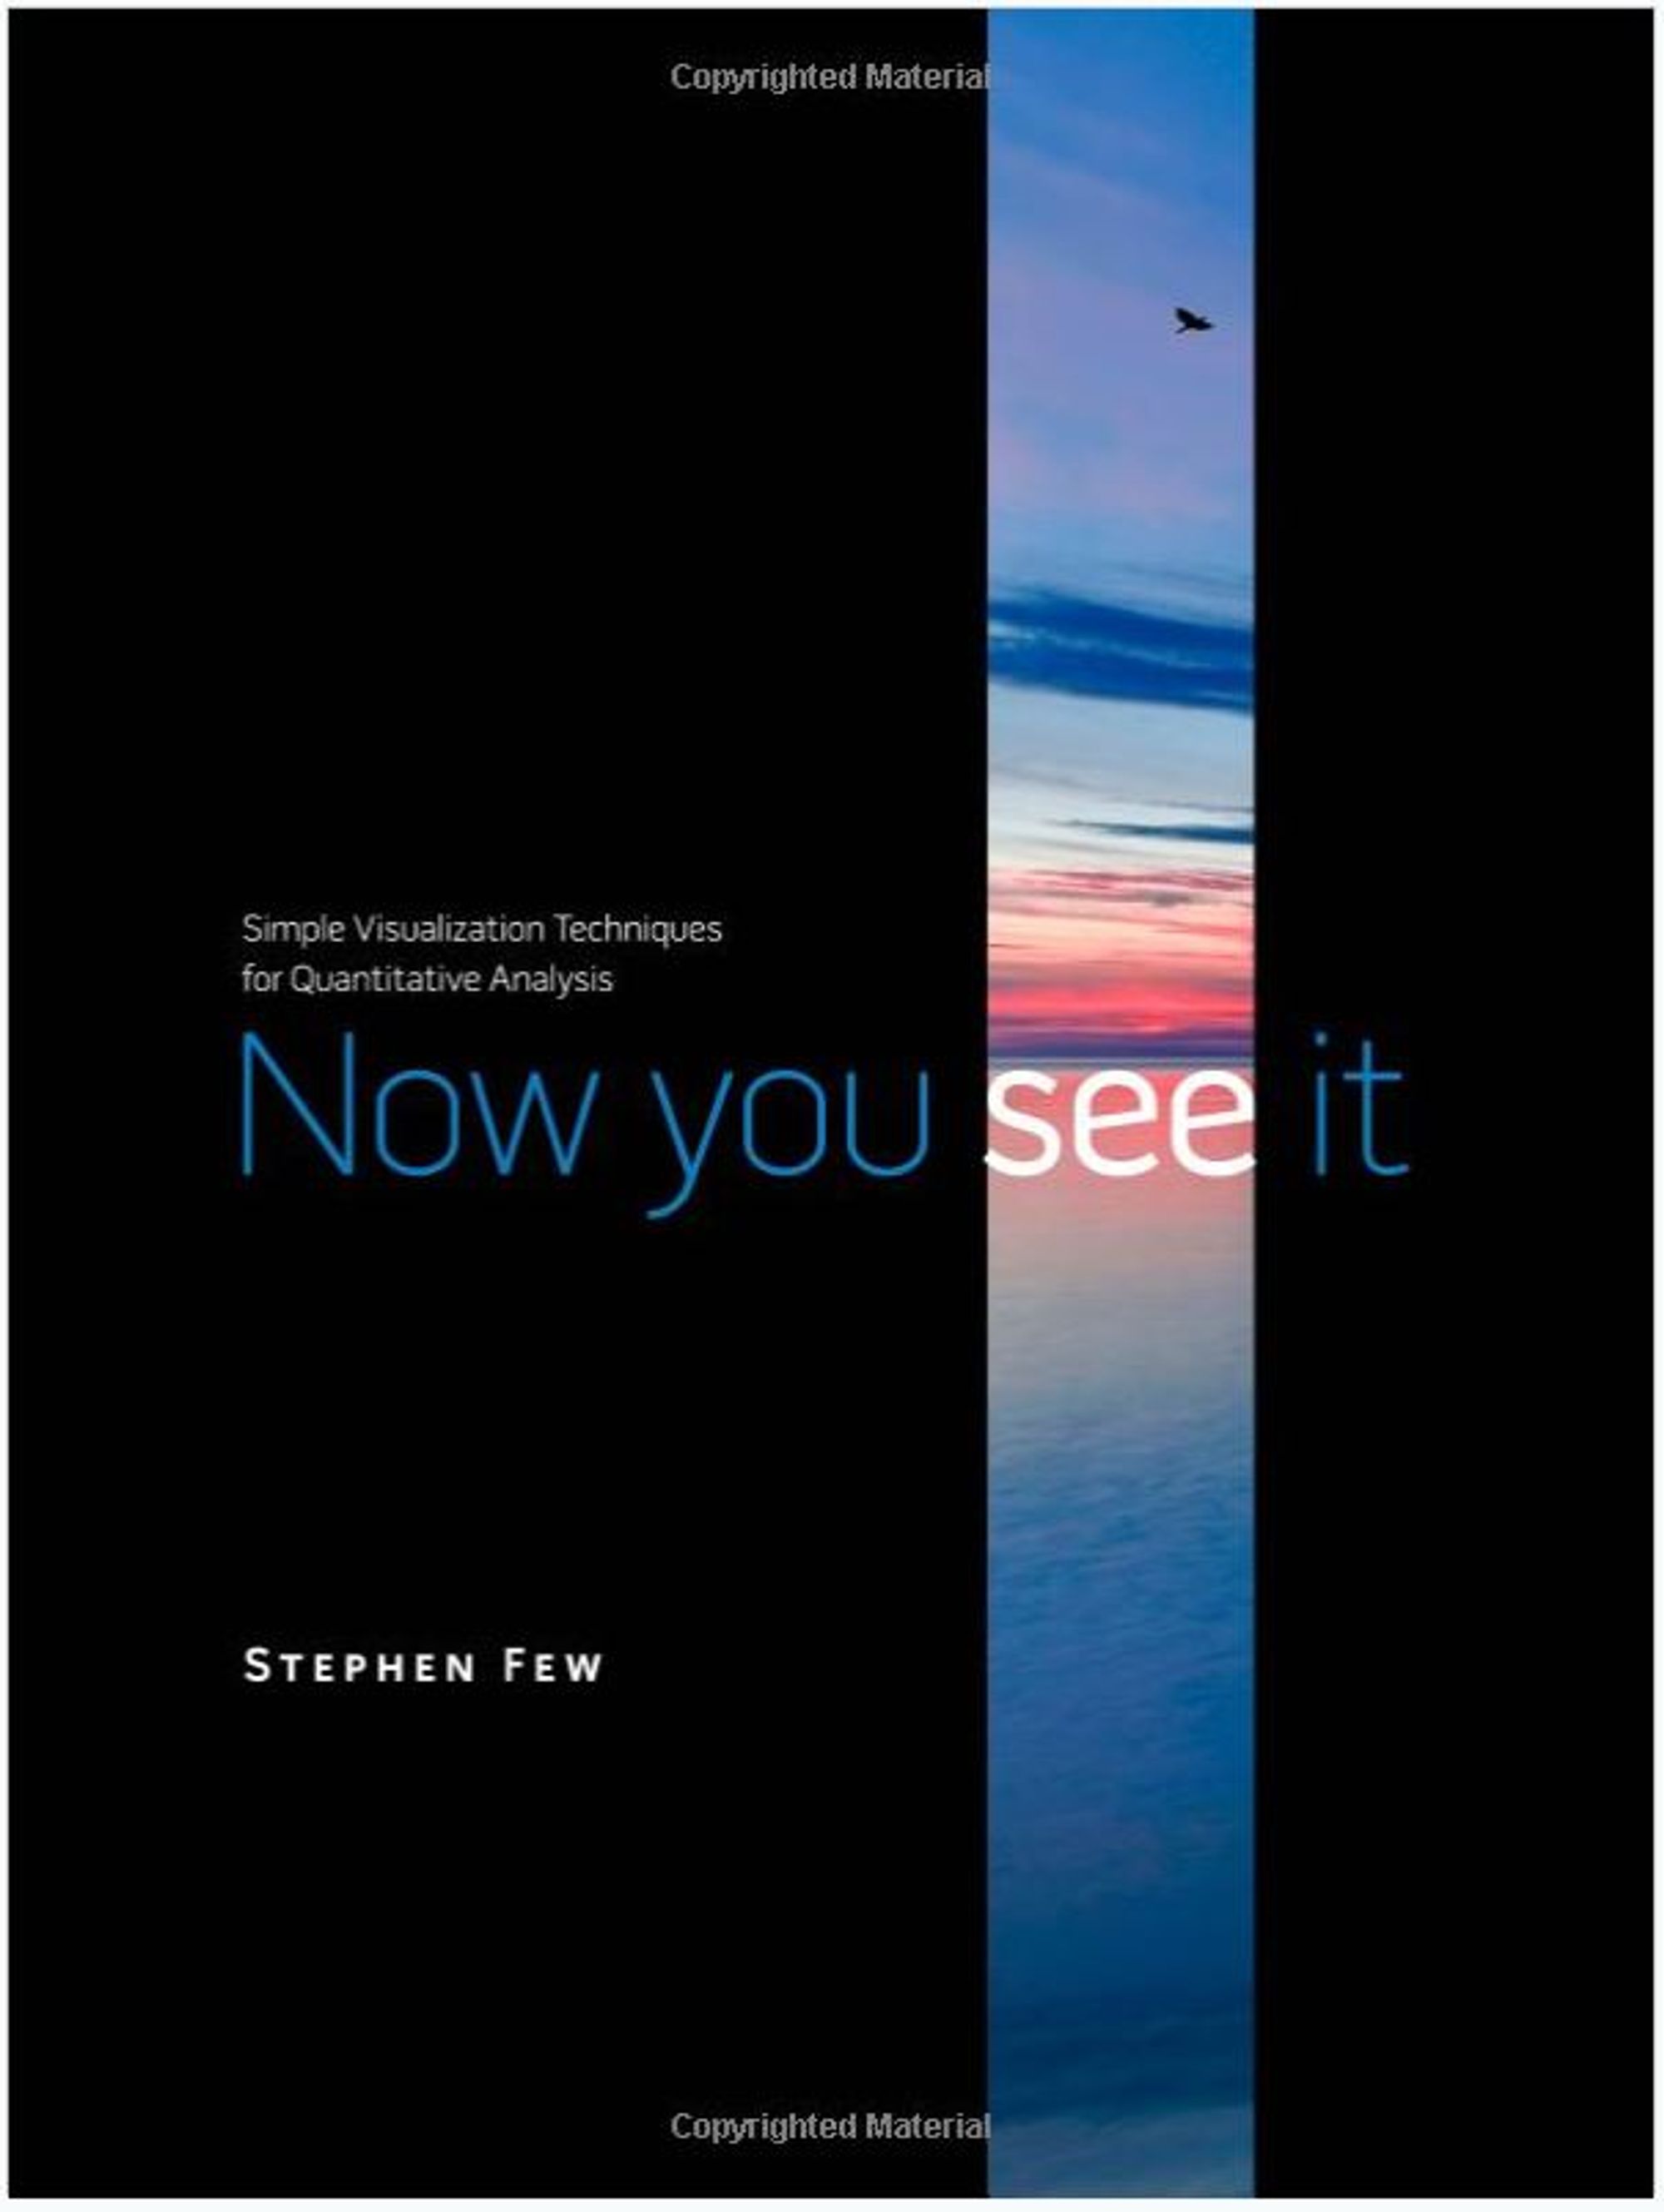
Now you see it
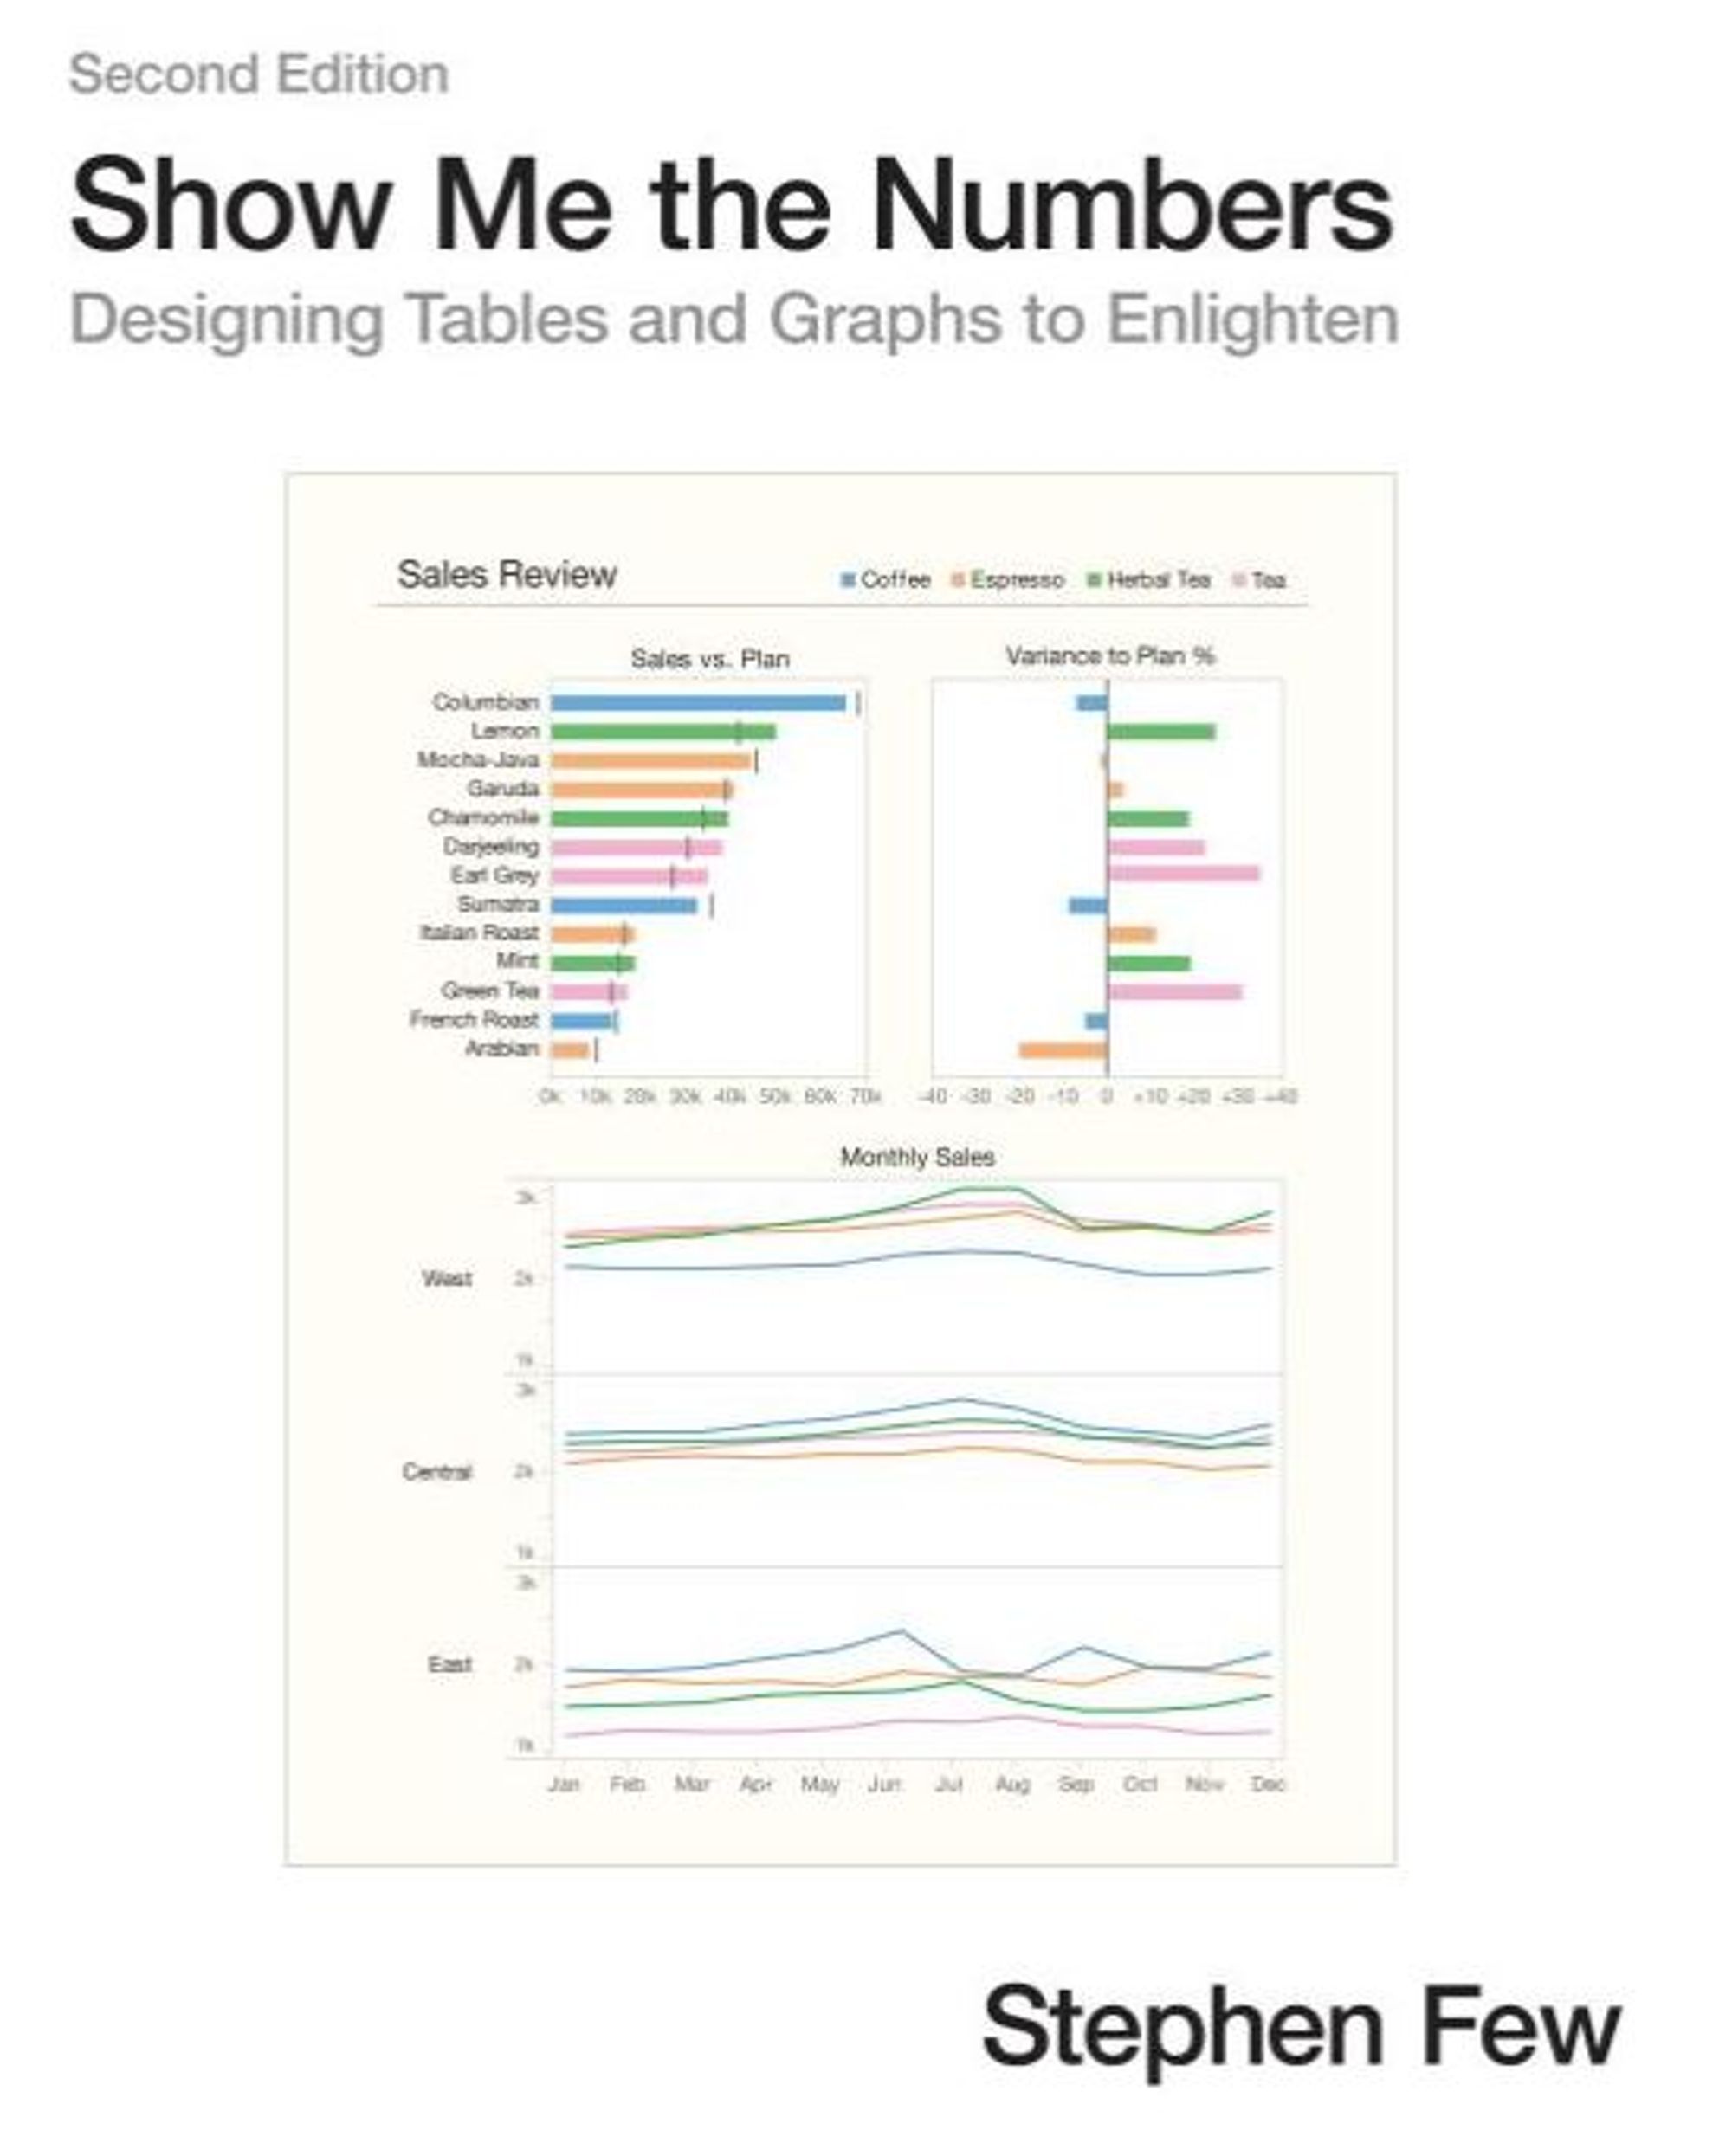
Show me the number

Manuel de Datavisualisation

ggplot2 elegant graphics for data analysis

Convaincre avec des graphiques efficaces

The Visual Display of Quantitative Information

Storytelling with data

Le canal royal de Languedoc - le partage des eaux

Pratiques de la cartographie

Artistes de la carte
de la Renaissance au XXIe siècle

W. E. B. Du Bois's Data Portraits: Visualizing Black America Représenter l'Amérique noire au tournant du XXe siècle

History of Information Graphics

Factfulness

La graphique et le traitement graphique de l'information

Data sketches

Data Flow

The Wall Street Journal Guide to Information Graphics

Guide du data journalisme

How to lie with statistics

Interactive Data Visualization for the Web: An Introduction to Designing with D3

How Charts Lie

Visualization Analysis & Design

Data Visualisation

Dear Data

Data Visualization with Python and JavaScript